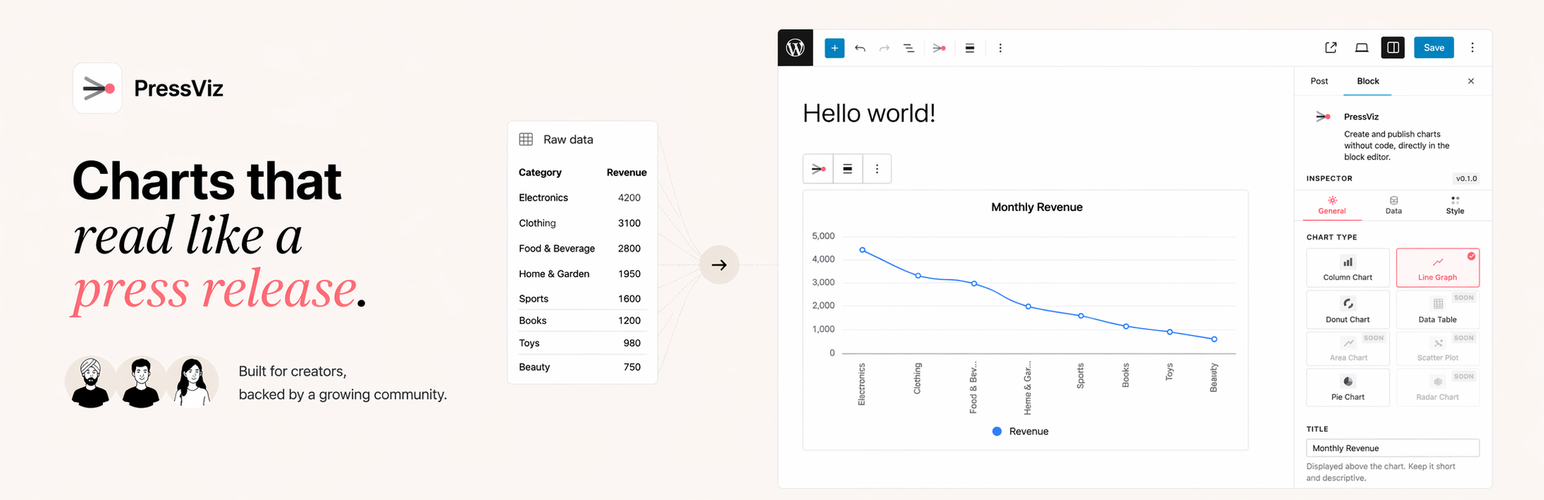
PressViz is a WordPress chart plugin for people who want to publish clear, responsive charts without leaving the block editor.
Most chart tools make you jump between dashboards, embeds, shortcodes, spreadsheets, and third-party services. PressViz keeps the chart workflow inside WordPress: add the PressViz block, enter data manually or upload a CSV, choose a chart type, style it in the sidebar, and publish.
Learn more at https://getpressviz.com
Why WordPress Charts Still Feel Hard
A chart should help a reader understand the story faster. Too often, the workflow gets in the way.
- You leave WordPress to build the chart in another tool
- You paste shortcodes or embeds instead of editing in the post
- Chart data and table data live in separate plugins
- Hosted charts depend on external services, accounts, or scripts
- Canvas-only charts can be hard for screen readers, search engines, and AI crawlers to understand
- Editors inherit charts they are afraid to update later
PressViz is built for a cleaner workflow: chart creation, data editing, visual styling, and front-end rendering all stay connected to the WordPress post.
What You Can Build With PressViz
📊 Charts inside the block editor
Create charts directly in Gutenberg with a native block, guided starter flow, live preview, and sidebar controls.
📁 CSV import and manual data entry
Start from a CSV file, paste numbers into the editable grid, or type values by hand. PressViz is useful for quick editorial charts, reports, comparisons, and data snapshots.
📈 Multiple chart types
Publish bar, line, area, pie, doughnut, scatter, radar, gauge, and funnel charts from one WordPress chart block.
🧾 Chart data that remains part of your site
PressViz stores chart data in your WordPress database using a custom table. You do not need an external chart service, CDN-hosted chart script, or third-party dashboard just to publish one useful chart.
🎨 No-code styling controls
Adjust chart type, title, subtitle, colors, legend, labels, spacing, animation, and responsive behavior without writing code.
📤 Front-end export buttons
Let readers download a chart as a PNG image or export the underlying data as CSV.
Built for SEO, Accessibility, and AI Crawlers
A chart should not become a blank visual shell once it reaches search engines, screen readers, or AI crawlers.
PressViz is designed to make chart output more understandable beyond the canvas. It includes accessible output, screen-reader-friendly data, and structured dataset markup so the chart can carry meaning as content, not just decoration.
That matters for:
- Search engines trying to understand the data behind a chart
- AI crawlers and answer engines reading page context
- Screen reader users who need the data behind the visual
- Publishers who want charts to remain useful, portable, and understandable over time
Read the full SEO and AI crawling breakdown:
https://www.getpressviz.com/pressviz-built-in-for-seo
Why PressViz Is Different
- Block editor native: PressViz is built around the modern WordPress editor, not bolted onto it through old shortcode-era workflows.
- No external chart dashboard: Create, edit, preview, and update charts where you already write.
- Local rendering, no CDN dependency: ECharts is bundled locally, so your charts do not depend on loading a chart library from a third-party CDN.
- Accessible chart output: PressViz includes chart descriptions, semantic output, and screen-reader-friendly data table support.
- SEO-friendly chart metadata: Structured Dataset markup helps make charts more understandable to search engines and AI systems.
- Editor-friendly handoff: Agencies, freelancers, and site builders can hand clients a chart workflow they can keep using after launch.
Who PressViz Is For
PressViz is useful for:
- Publishers and editorial teams explaining data inside articles
- Marketers sharing campaign reports, performance summaries, and comparison charts
- Agencies building WordPress sites that clients need to maintain themselves
- Bloggers and creators who want a simple chart block without a separate dashboard
- Nonprofits, educators, and business teams publishing data snapshots or public reports
If you are searching for a WordPress chart plugin, Gutenberg chart block, CSV chart plugin, responsive chart plugin, or accessible data visualization tool for WordPress, PressViz is built for that workflow.
How It Works
- Add the PressViz block to any post or page
- Enter data manually or import a CSV file
- Choose a chart type
- Customize colors, labels, legends, spacing, and responsive behavior
- Publish a responsive, accessible chart on your WordPress site
Features
- WordPress chart block for the Gutenberg editor
- Bar, line, area, pie, doughnut, scatter, radar, gauge, and funnel charts
- CSV import and manual data entry
- Editable spreadsheet-style data grid
- Chart title, subtitle, color, legend, spacing, label, and animation controls
- Front-end PNG and CSV export buttons
- Responsive chart output for desktop, tablet, and mobile
- Accessible chart descriptions and screen-reader-friendly data table output
- SEO-friendly schema.org Dataset markup
- Local ECharts bundle with no CDN dependency
- Site-wide defaults for common chart settings
- Per-chart overrides in the block inspector
- More features are coming, including chart management, reusable datasets, AI-assisted chart creation, and richer table workflows
Links
- Website: https://getpressviz.com
- SEO and AI crawling breakdown: https://www.getpressviz.com/pressviz-built-in-for-seo
- Documentation: https://getpressviz.com/docs
External Services
PressViz optionally sends deactivation feedback to a Google Sheets endpoint via Google Apps
Script when a user submits the deactivation form. No data is sent if the user clicks
“Skip & Deactivate” or dismisses the modal. Data sent: deactivation reason code and label,
optional free-text details, site URL, WordPress version, plugin version, plugin slug, PHP
version, and a UTC timestamp.
Service: https://script.google.com
Privacy policy: https://policies.google.com/privacy
Third-Party Libraries
- ECharts 6.x (https://echarts.apache.org) – Apache License 2.0 – Bundled locally, no external requests