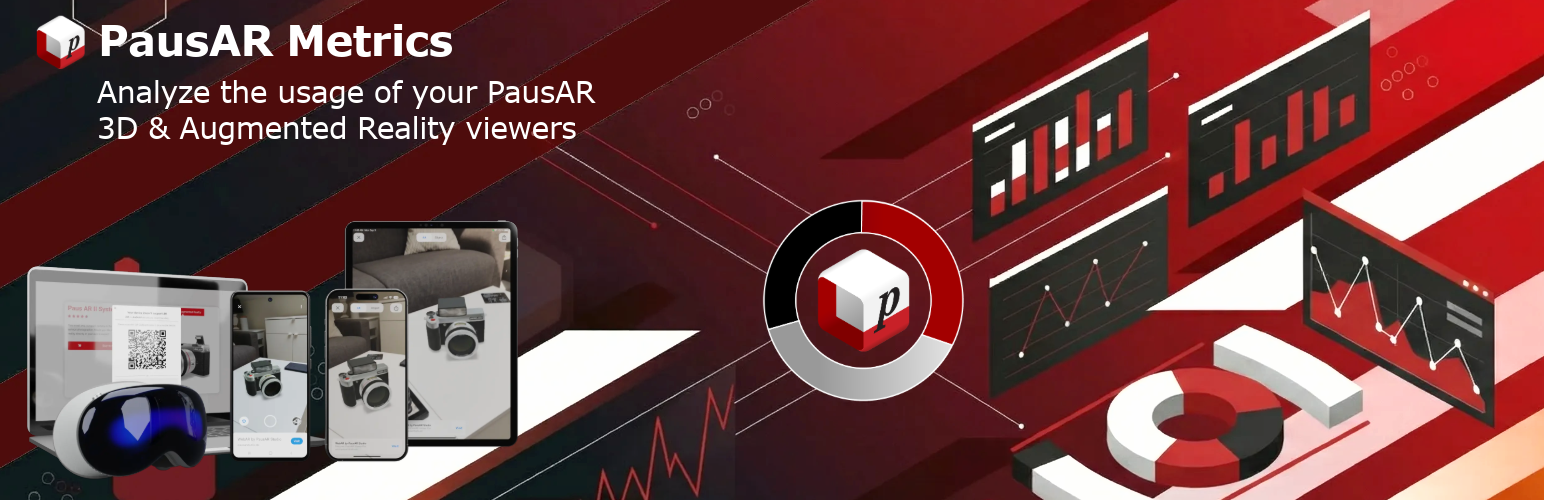

PausAR – 3D and AR Viewer Metrics gives you a clear picture of how visitors engage with your PausAR powered 3D models and AR experiences on your website. See which pages and 3D models get the most attention, track trends over time, and make data-driven decisions – all without slowing down your site or compromising visitor privacy.
Requires: PausAR – 3D & AR for Elementor (Free or Pro)
Features (Free Version):
- Interactive line chart – Visual analytics dashboard with an interactive timeline showing your 3D & AR interactions over the last 7 days, right inside WordPress.
- Event distribution donut chart – Instantly see the split between 3D Viewer interactions, QR Code scans, and AR session launches at a glance.
- Summary cards – Totals for 3D viewer interactions, QR codes generated, AR launches, and pages with activity.
- Sortable data table – Sort your pages by 3D viewer interactions, QR codes generated, AR launches, or widget count.
- Filter data by URL – Filter the shown data by URL (e.g. /products/).
- Dashboard widget – A compact overview widget on the main WordPress Dashboard page showing key metrics for the last 7 days and today – always visible at a glance.
- Top 3 Pages – See your three best-performing pages ranked by total interactions, with a colour-coded breakdown bar showing the split between 3D Viewer, QR, and AR events.
- Data retention: 7 days – Interaction data is stored for 7 days and automatically cleaned up afterwards or manually with a click of a button.
- Stop all Tracking Button: With the click of a button you can disable or enable the PausAR tracking script.
- Privacy-friendly – No cookies, no IP addresses, no device fingerprinting, and no external connections. Only aggregated counters are stored in your own WordPress database.
- AR platform breakdown – See how AR sessions split between Apple (iOS) and Android devices with a dedicated donut chart and per-row breakdown in the data table.
Features (Pro Version):
- All free features included – Everything from the free version is also included in the Pro version.
- Extended data retention – Store up to 365 days of interaction data. Choose between 7, 30, 90, 180, or 365 days.
- Extended date ranges – Analyse your data over 30, 90, 180, or 365 days in addition to the default 7-day and today views.
- Detailed page analysis – Drill down to individual pages and widgets to see exactly which 3D models drive the most engagement, with per-widget statistics, model info tooltips, and date range filtering.
- Per-widget tracking – Every PausAR widget on your site is tracked individually, so you know exactly which 3D models drive the most engagement.
- Rising Stars – Discover which pages are gaining momentum with the three pages showing the biggest percentage increase compared to the previous period.
- Needs Attention – Spot pages with declining engagement at a glance – the three pages with the biggest percentage drop compared to the previous period.
- Comparison mode – Toggle “Compare vs. previous period” in the line chart to overlay dashed lines from the previous period. Available for all ranges except 365 days, with comparison data visible in the chart tooltip.
- PDF Report Export – Export a branded PDF report with your logo, custom name, and accent color, including KPI summary cards, line chart with annotations, donut chart, and a full top pages table with mini bar charts. Customize branding in Settings.
- Chart annotations – Add colour-coded notes to your timeline to mark important events like product launches, newsletter sends, or website changes. Annotations appear as diamond markers on the chart and are visible in tooltips.
- Export to Excel – Download the currently visible data table as an XLSX file with one click.
- Automated email reports – Receive weekly (every Monday) or monthly (1st of each month) HTML email summaries with total interactions, trend comparisons, and your top 5 pages.
- Priority email support – Get dedicated support for any questions or issues.
Check out pricing and full features of PausAR Metrics Pro today!
🎯 What Is Measured?
PausAR Metrics records three types of interactions:
- 3D Viewer Interaction – a visitor interacts with the 3D model (once per widget per page visit)
- QR Code Generated – the AR button is clicked on a device without AR support (desktop) and the QR code popup is shown
- AR Session Started – the AR button is clicked or AR autostart is launched on a device with AR support, with Apple / Android platform detection
No personal data is collected. There are no cookies, no IP addresses, no device fingerprinting, and no connections to external servers. Only aggregated counters (event type, page URL, widget ID, date, and hour) are stored in your own WordPress database.